Overslaan naar de hoofd content

Thijs Cobben – Data Alchemist

This site is a provocation to the GDPR. Read why here. Join the campaign: check the ultimate box to kill the cookie banner →

We use Google Consent Mode: if your browser sends a Global Privacy Control or Do Not Track signal, Google Analytics sets no cookies. Otherwise, as our privacy policy explains, we use so-called functional cookies from Google Analytics, plus a few tiny ones that remember your privacy choice. Rather not? Then you are free to leave this site right away.

Speaking · Keynotes · In-house sessions

Two thousand years of data, one evening your audience won’t forget.

I tell the story of data the way it actually happened — through Roman censors, burning archives and the inventions of the 1970s — and turn it into lessons your data team, board or audience can use on Monday morning.

40 years in the data craftEnglish or DutchNo vendor slides
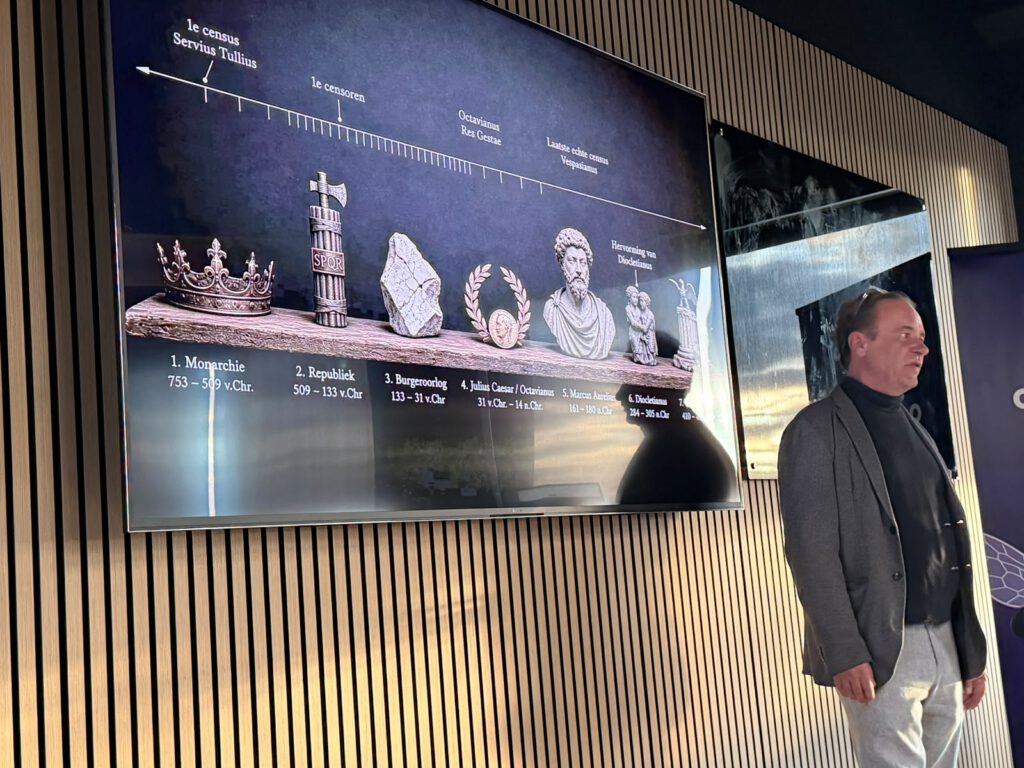
Thijs Cobben presenting The Roman Census at Greater.nl
Thijs CobbenLive: The Roman Census at Greater.nl
The talks

Pick a century. I’ll bring it back to yours.

Both talks come from the research behind my book History of Data. Each runs as a 45-minute keynote or a longer interactive session, and I tailor the closing lessons to your sector and audience.

I
578 BC – AD 74
  • Format45-min keynote, or 75 min with Q&A
  • Best forData & governance teams, leadership offsites, privacy and public-sector audiences
  • LanguageEnglish or Dutch
Talk I

The Roman Census

… and what we can learn from it today

In the sixth century BC a Roman king, said to have been born a slave, ordered every Roman citizen onto the Field of Mars. Name, father, age, wife, children and every possession, declared in public — and anyone who stayed away could lose their property and be sold into slavery. With that, Rome built the first database that ran a state: one register that decided who paid tax, who fought in the front line and whose vote counted.

In this talk I treat the Roman census as what it really was: a data system. We follow it from its origin to the censors who kept it, from the burning of the archive on the Capitol in 83 BC to the bronze and wax records that replaced it. And we look east to Han China, which counted 59.6 million people in AD 2 with a household register whose descendant is still in use today.

Every data problem your organisation struggles with today, Rome had first. Some of its solutions were better than ours.

What your audience will hear

  • The free-rider problem. Why a fast-growing Rome had to switch from birth to wealth as its key — a schema change that rewired tax, army and politics in one go.
  • The censors. Two elected officials with 18-month terms and the power to demote a senator with one note. The first data stewards, with real teeth.
  • Who counted — and who didn’t. Citizens and independent women declared themselves; slaves, up to a quarter of Italy, did not exist in the data.
  • When the list becomes a weapon. From moral notes to Sulla’s proscriptions: the same register, a very different use.
  • Fire, bronze and continuity. The archive that burned, the Tabularium that still stands, and why China’s registers outlived dynasties while Rome’s did not.

What they take home

  • Data is never neutral. Your schema decides who counts. Ask who is missing from your dataset.
  • Measurement changes behaviour. Romans hid wealth from the censor; your teams game your KPIs. Design for it.
  • Governance needs a person, not a policy. What the censor had that most data owners lack: mandate, term and consequences.
  • Plan for the fire. Lineage, redundancy and a Tabularium of your own.
  • Purpose drift is the real risk. Data collected for one goal will be used for another. Decide the limits before someone else does.
Data governanceData ethics & privacyHistory of dataLeadership
Invite me for this talk →
II
1970 – today
  • StatusIn development — early bookings shape the final cut
  • Format45-min keynote, or 75 min with Q&A
  • Best forData & analytics teams, architecture and platform leads, CDO and CIO forums
  • LanguageEnglish or Dutch
Talk II · New

The Impact of Invention

How the inventions of the 1970s still shape the way we handle data today

In 1970 Ted Codd proposed something radical: describe data by what it means, not by where it sits on disk. Within a few years there was a formal query language to go with it, and a clean split between the logical model and the physical storage underneath. Programmers stopped chasing pointers and started talking about data. That is the best idea our profession ever had.

Fifty years later, most data platforms have quietly lost it. The spreadsheet arrived in 1979 and never left. Reporting databases grew into heavy central warehouses. Data lakes gave data scientists freedom without governance. And today’s lakehouses are often so over-architected that the tooling buries the data it was meant to serve.

This talk follows the line from SQL to the OLAP cube, to the pandas dataframe, to the autonomous data warehouse — and shows how much of that line was shaped by accident and by a Darwinian struggle between inventions rather than by design. Knowing which of your choices are inherited accidents is the first step to making better ones.

The best idea in data management is fifty years old. Most platforms have forgotten it.

What your audience will hear

  • What the seventies got right. Separating the logical layer from the data layer. A query language with formal semantics. Keeping transactions (OLTP) and analysis (OLAP) apart.
  • What went wrong after. Excel as the shadow data platform. The ‘reporting database’ that became a monolith. Ungoverned lakes. Lakehouses where nobody can find the data under the tooling.
  • One line, fifty years. SQL → OLAP cube → pandas dataframe → autonomous data warehouse. What each step gained, and what it threw away.
  • Survival of the fittest — or the luckiest. Why winning technologies are rarely the best designed, and how informal, bottom-up standardisation picks the winners.

What they take home

  • Meaning before machinery. Put the logical model back at the centre of your platform.
  • Spot your inherited accidents. Which parts of your stack are there by design, and which by history?
  • Less architecture, more reliability. A simple test for whether your tooling serves the data — or the other way round.
  • Read the next step early. What the autonomous warehouse and AI agents will inherit from fifty years of choices — good and bad.
Data architectureData modellingPlatform strategyHistory of data
Invite me for this talk →
Why book these talks

History as a mirror, not a museum.

Stories people repeat

A king born a slave, a censor who could strike a senator off the list, a pig, a sheep and a bull at the end of every count. Your audience will retell them at the coffee machine — and remember the lesson attached.

A shared language

History gives a mixed room — engineers, managers, the board — neutral ground to talk about data without getting stuck in the politics of your own platform.

Made for your room

Conference keynote, team offsite, lunch session or customer event. Before every talk we have a short call so the closing lessons match your sector and your audience.

Invite me to speak

Tell me about your audience. I’ll tell you what I’d bring.

Conference, company event, data team offsite or a small dinner with your leadership team — every request gets a personal reply within two working days.

  1. You send the basicsDate, audience, the talk you have in mind. Two minutes.
  2. We have a short callFifteen minutes on your audience and what should stick with them.
  3. I tailor the talkSame stories, lessons sharpened for your sector and your room.

Rather talk first? Book a 30-minute call.

Which talk?

You’ll get a confirmation by email.

Thank you — invitation received.

A confirmation is on its way to your inbox. I’ll reply personally within two working days.